Waveforms of Therapeutic Currents: Difference between revisions
Rachael Lowe (talk | contribs) mNo edit summary |
No edit summary |
||
| (12 intermediate revisions by 3 users not shown) | |||
| Line 1: | Line 1: | ||
= | <div class="editorbox"> | ||
Therapeutic currents are, special electric currents that are applied to human body for healing the body. Generally these are defined by using voltage-time chart of the current which can be seen in the oscilloscope screen. | '''Original Editor''' - [[User:Rafet Irmak|Rafet Irmak]] | ||
'''Top Contributors''' - {{Special:Contributors/{{FULLPAGENAME}}}} | |||
</div> | |||
==Waveforms of Therapeutic Currents== | |||
Therapeutic currents are, special electric currents that are applied to human body for healing the body. Generally these are defined by using voltage-time chart of the current which can be seen in the oscilloscope screen. This page summaries the waveform of common therapeutic currents<ref>[https://play.google.com/store/books/details/Rafet_IRMAK_Atlas_of_Electrotherapy_I_Waveforms_an?id=2ZbIDwAAQBAJ Rafet IRMAK, Atlas of Electrotherapy -I : Waveforms and Electrode Placements for Cervical, Thoracic and Lumbosacral Regions]</ref>. | |||
== Fundamental Terms == | == Fundamental Terms == | ||
=== | === Oscilloscope === | ||
An ossiloscope is an instrument which is used to observe voltage changes during time in electric circuits. | An ossiloscope is an instrument which is used to observe voltage changes during time in electric circuits. | ||
| Line 21: | Line 27: | ||
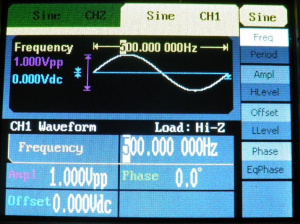
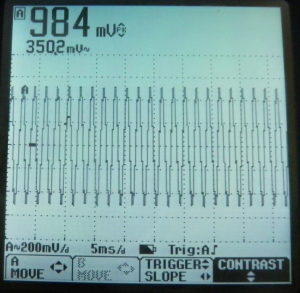
==== A 500 Hz Sine Wave ==== | ==== A 500 Hz Sine Wave ==== | ||
{| class="wikitable" | {| class="wikitable" | ||
![[File:Electro altlas figure 4.png|thumb|Figure 4: Signal generator settings for sine wave at 500 Hz frequency and 1V peak amplitude]] | ![[File:Electro altlas figure 4.png|thumb|Figure 4: Signal generator settings for sine wave at 500 Hz frequency and 1V peak amplitude|center]] | ||
![[File:Electro atlas figure 5.png|thumb|Figure 5: | ![[File:Electro atlas figure 5.png|thumb|Figure 5: Osiloscope screen shot for sine wave at 500 Hz frequency and 1V peak voltage amplitude.|center]] | ||
|} | |} | ||
| Line 28: | Line 34: | ||
{| class="wikitable" | {| class="wikitable" | ||
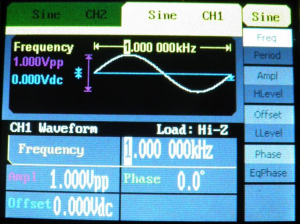
![[File:Electroterapi atlasi figure 6.png|thumb|Figure 6: Signal generator site for sine wave at 1000 Hz frequency and 1V peak amplitude]] | ![[File:Electroterapi atlasi figure 6.png|thumb|Figure 6: Signal generator site for sine wave at 1000 Hz frequency and 1V peak amplitude]] | ||
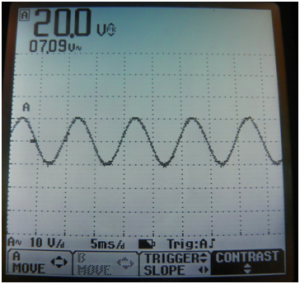
![[File:Electroterapi atlasi figure 7.png|thumb|Figure 7: | ![[File:Electroterapi atlasi figure 7.png|thumb|Figure 7: Osciloscope screen shot for sine wave at 1000 Hz frequency and 1V peak voltage amplitude.]] | ||
|} | |} | ||
| Line 43: | Line 49: | ||
{| class="wikitable" | {| class="wikitable" | ||
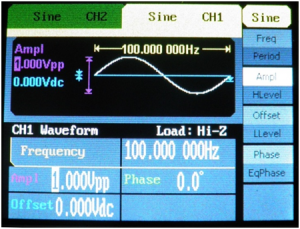
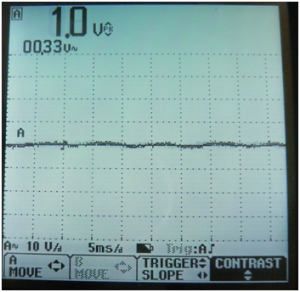
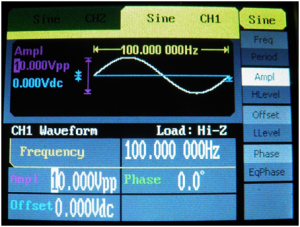
![[File:Electroterapi atlasi image 8.png|thumb|Figure 8: Signal generator parameters for a sine wave at 100 Hz and 1V.]] | ![[File:Electroterapi atlasi image 8.png|thumb|Figure 8: Signal generator parameters for a sine wave at 100 Hz and 1V.]] | ||
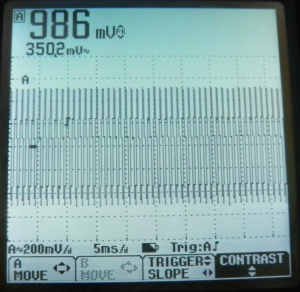
![[File:Electroterapi atlasi figure 9.png|thumb|Figure 9: | ![[File:Electroterapi atlasi figure 9.png|thumb|Figure 9: Osciloscope screen shot for peak and mean amplitudes of a 100 Hz 1 Volt sine wave.]] | ||
|} | |} | ||
Peak and Mean Amplitude of 1000 Hz (1KHz) and 10 Volt Sine Wave | Peak and Mean Amplitude of 1000 Hz (1KHz) and 10 Volt Sine Wave | ||
{| class="wikitable" | {| class="wikitable" | ||
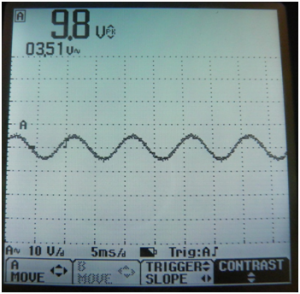
![[File:Electroterapi atlasi image 10.png|thumb|Figure 10: Signal generator parameters for a sine wave at 100 Hz and 10 V.]] | ![[File:Electroterapi atlasi image 10.png|thumb|Figure 10: Signal generator parameters for a sine wave at 100 Hz and 10 V.]] | ||
![[File:Electroterapi atlasi image 11.png|thumb|Figure 11: | ![[File:Electroterapi atlasi image 11.png|thumb|Figure 11: Osciloscope screen shot for peak and mean amplitute of a 100 Hz, 10V sine wave.]] | ||
|} | |} | ||
Peak and Mean Amplitude of 1000 Hz (1KHz) and 20 Volt Sine Wave | Peak and Mean Amplitude of 1000 Hz (1KHz) and 20 Volt Sine Wave | ||
{| class="wikitable" | {| class="wikitable" | ||
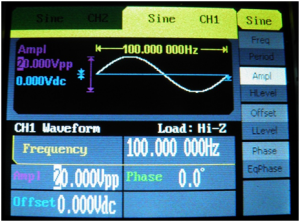
![[File:Electroterapi atlasi figure 12.png|thumb|Figure 12: Signal generator parameters for Peak and mean amplitude of a sine wave at 100 Hz and 20V.]] | ![[File:Electroterapi atlasi figure 12.png|thumb|Figure 12: Signal generator parameters for Peak and mean amplitude of a sine wave at 100 Hz and 20V.]] | ||
![[File:Electroterapi atlasi figure 13.png|thumb|Figure 13: | ![[File:Electroterapi atlasi figure 13.png|thumb|Figure 13: Osciloscope screen shot for peak and mean amplitute of a 100 Hz, 20V sine wave.]] | ||
|} | |} | ||
| Line 62: | Line 68: | ||
{| class="wikitable" | {| class="wikitable" | ||
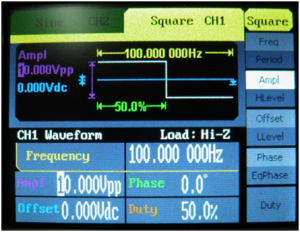
![[File:Electroterapi atlasi image 14.png|thumb|Figure 14: Signal genrator settings for 10 V, %50 duty cycle, square waveform]] | ![[File:Electroterapi atlasi image 14.png|thumb|Figure 14: Signal genrator settings for 10 V, %50 duty cycle, square waveform]] | ||
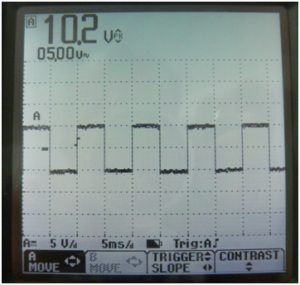
![[File:Electroterapi atlasi figure 15.png|thumb|Figure 15: | ![[File:Electroterapi atlasi figure 15.png|thumb|Figure 15: Osciloscope screen shot for 10 V, 50% duty cycle, square wave]] | ||
|} | |} | ||
| Line 68: | Line 74: | ||
{| class="wikitable" | {| class="wikitable" | ||
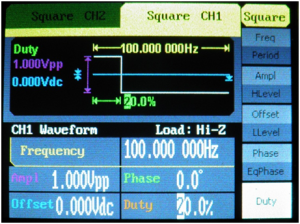
![[File:Electroterapi atlasi figure 16.png|thumb|Figure:16 Signal generator settings for 10 V, 20% duty cycle, square waveform]] | ![[File:Electroterapi atlasi figure 16.png|thumb|Figure:16 Signal generator settings for 10 V, 20% duty cycle, square waveform]] | ||
![[File:Electroterapi atlasi figure 17.png|thumb|Figure 17: | ![[File:Electroterapi atlasi figure 17.png|thumb|Figure 17:Osciloscope screen shot for 10 V, 20% duty cycle, square wave]] | ||
|} | |||
50% Duty Cycle Square Waveform | |||
{| class="wikitable" | |||
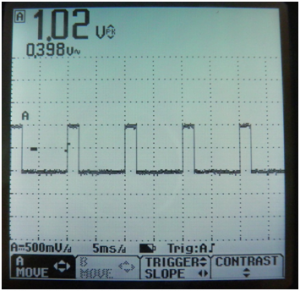
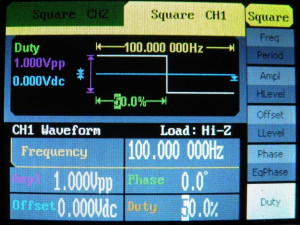
![[File:Electrotheraphy atlas figure 17.png|thumb|Figure 18: Signal generator settings for 1 V, 100 Hz 50% duty cyle, square waveform]] | |||
![[File:Electrotheraphy Atlas figure 19.png|thumb|Figure 19: Osciloscope screen shot for 1V, 100 Hz, 50% duty cycle, square waveform]] | |||
|} | |} | ||
75% Duty Cycle Square Waveform | |||
{| class="wikitable" | |||
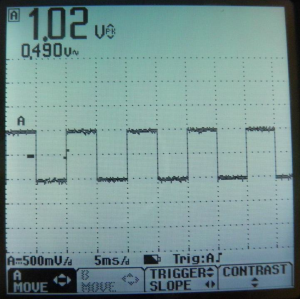
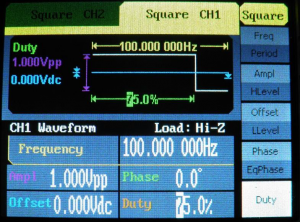
![[File:Figure 20- Signal generator settings for 1 V, 75% duty cycle, square wave form.png|thumb|Figure 20: Signal generator settings for 1 V, 75% duty cycle, square wave form]] | |||
![[File:Ea 21.png|thumb|Figure 21: Osciloscope screen shot for 1V, 100Hz, 75% duty cyclesquarewaveform]] | |||
|} | |||
== References == | |||
<references /> | |||
[[Category:Electrophysical]] | |||
Latest revision as of 15:55, 9 January 2020
Original Editor - Rafet Irmak
Top Contributors - Admin, Rafet Irmak, Rachael Lowe and Kim Jackson
Waveforms of Therapeutic Currents[edit | edit source]
Therapeutic currents are, special electric currents that are applied to human body for healing the body. Generally these are defined by using voltage-time chart of the current which can be seen in the oscilloscope screen. This page summaries the waveform of common therapeutic currents[1].
Fundamental Terms[edit | edit source]
Oscilloscope[edit | edit source]
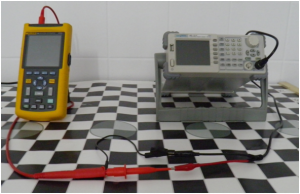
An ossiloscope is an instrument which is used to observe voltage changes during time in electric circuits.
Signal Generator[edit | edit source]
A signal generator is an instrument which generates electrical signals at given waveform, frequency and amplitude. Electrotherapy equipment is a kind of signal generator which generates therapeutic signal waveforms in safe frequency and amplitude.
Frequency[edit | edit source]
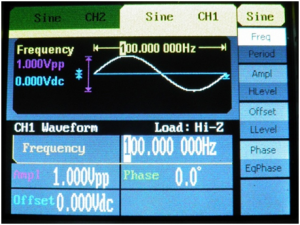
Frequency is a term which describes how many times a waveform repeat it self per second by signal generator.
A 100 Hz Sine Wave[edit | edit source]
A 500 Hz Sine Wave[edit | edit source]
A 1000 Hz Sine Wave[edit | edit source]
Peak Amplitude[edit | edit source]
The term peak amplitude defines the highest positive or negative value of a waveform. In therapeutic currents peak amplitude generally defines the highest value of the voltage during time.
Peak to Peak Amplitude[edit | edit source]
The term peak to peak amplitude defines the amplitude between the highest negative to highest positive value. Peak to peak amplitude of a sine wave is equal to two times peak value of a sine wave.
Mean Amplitude[edit | edit source]
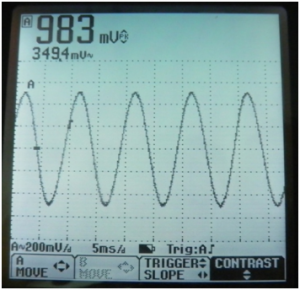
The term mean amplitude defines mean value of a waveform. In therapeutic currents mean amplitude is a quantity in terms of voltage. Peak amplitude of a sine wave has different mean amplitude value. Mean amplitude of a sine wave is equal to 0.637 x Peak Amplitude.
Peak and Mean Amplitude of 100 Hz and 1 Volt Sine Wave[edit | edit source]
Peak and Mean Amplitude of 1000 Hz (1KHz) and 10 Volt Sine Wave
Peak and Mean Amplitude of 1000 Hz (1KHz) and 20 Volt Sine Wave
Square Waveform[edit | edit source]
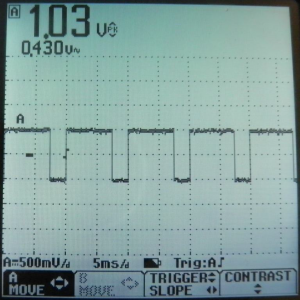
Square waveform is a common therapeutic waveform. Interrupted galvanic current and TENS are forms of Square waveform. The main parameter of a square waveform is duty cycle. It defines the time ratio when voltage is higher or lower then zero and when voltage is equivalent to zero.
50% Duty Cycle Square Waveform[edit | edit source]
20% Duty Cycle Square Waveform[edit | edit source]
50% Duty Cycle Square Waveform
75% Duty Cycle Square Waveform
