File:Atherosclerosis diagram.png: Difference between revisions
Marleen Moll (talk | contribs) No edit summary |
(No difference)
|
Revision as of 14:18, 12 May 2020
The illustration shows a normal artery with normal blood flow (figure A) and an artery containing plaque buildup (figure B).
File history
Click on a date/time to view the file as it appeared at that time.
| Date/Time | Thumbnail | Dimensions | User | Comment | |
|---|---|---|---|---|---|
| current | 14:18, 12 May 2020 | 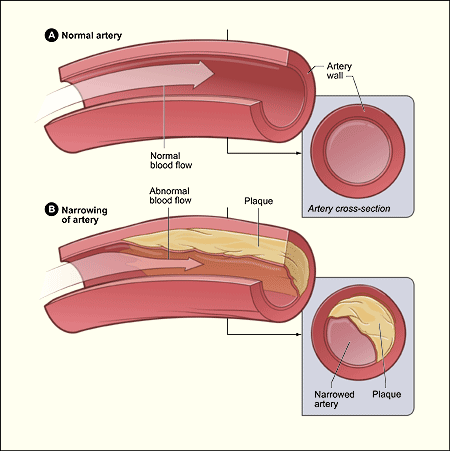 | 450 × 451 (41 KB) | Marleen Moll (talk | contribs) |
You cannot overwrite this file.
File usage
The following 5 pages use this file:

